Overview
The Course Report is the bird’s-eye view of training on your site: how many learners and courses you have, what’s being completed, and how each course is performing — with the ability to drill into any course for the detail.
This report is for LearnDash data and progress completion across lessons and topics in LearnDash courses. Data for SCORM/xAPI modules is included in the Tin Can report.
Above the course table you’ll see:
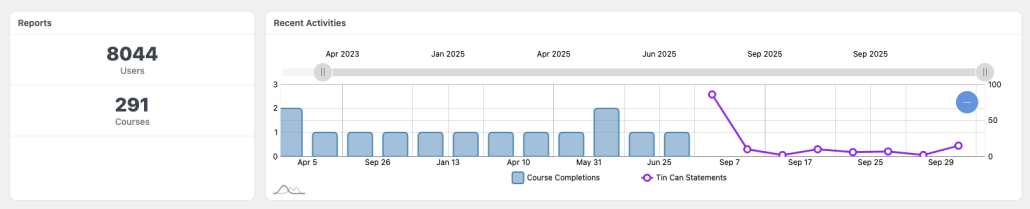
- A Reports panel with the total number of Users and Courses in scope.
- A Recent Activities chart plotting Course Completions and Tin Can Statements over time, with a date-range slider to zoom the timeframe.
A condensed version of this overview also appears on your WordPress Dashboard for an at-a-glance pulse.
Group Filter
At the top of the report is a Group filter. Choose a group from the dropdown and click Filter to scope the entire report — the activity chart, the totals, and the course table — to just that group’s learners.
- Administrators can filter by any group, or choose All Users to see everyone.
- Group Leaders are automatically limited to their assigned groups, and use the same dropdown to switch between the groups they lead.
You can set a default group under Tin Canny Reporting > Settings (v5.0) so the report opens already filtered to it. See Report defaults.
Course Table
Below the overview, the Course Table lists every course in scope. Columns include:
| Column | Shows |
|---|---|
| ID / Course | Course ID and title |
| Enrolled | Number of enrolled learners |
| Not Started / In Progress / Completed | Learner counts by status |
| Avg Quiz Score | Average quiz score for the course |
| % Complete | Overall completion percentage |
| Details | A See details link to the drill-down report |
| Avg Time To Complete / Avg Time Spent | Time columns shown when the Simple Course Timer module (Uncanny Toolkit Pro) is enabled |
You can search for a course by name and sort by any column heading. Note that these progress metrics track LearnDash lessons and topics — not the internal steps of an uploaded module.
Exporting
Use the Excel Export and CSV Export buttons above the table to download the current (filtered) course data for analysis or record-keeping.
Report defaults
Under Tin Canny Reporting > Settings you can set a default group and default page length so the report opens already filtered and sized to your needs (added in v5.0). This is a time-saver when you regularly report on the same group or work with many courses.
Drill-Down Course Report
Click a course’s See details link to open its detail report: overall performance for that course plus a list of enrolled users and their individual progress.
Related Articles
- User Report — the learner-centric companion view
- Front End LearnDash Reports — display this report on the front end
- Lesson and Topic Completion Reports — completion at the lesson/topic level
What’s the difference between time to completion and time spent
Hi Jordi, we’re happy to better define the 2 time values.
Time for completion: Records the exact time it took to complete the course, as measured by the Simple Course Timer module. It’s blank until the user completes the course, then the timestamp is recorded and cannot change. In other words, even if the user goes back into a course after completion, that extra time doesn’t increment the completion time.
Time spent (Course Cumulative Time in the Timer module) shows how much time a user has spent in the course. Completion is irrelevant, it’s just the total time a user has spent in a course before and after completion.