
Overview
Front-end reports put Tin Canny’s reporting on a WordPress page, so administrators and Group Leaders can review course and learner data without logging into the WordPress admin dashboard. It’s the foundation for letting client managers run their own reports.
What they are
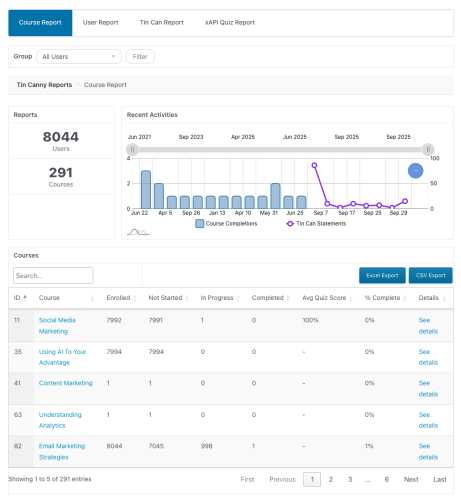
The Tin Canny Course/User Report block or [tincanny] shortcode renders the full reporting interface on the front end — Course Report, User Report, and (if enabled) Tin Can and xAPI Quiz reports — in one tabbed view. Add it to any page:
[tincanny]Tip: Reports are wide tables. Use a full-width page template with no sidebar so the columns aren’t squeezed.
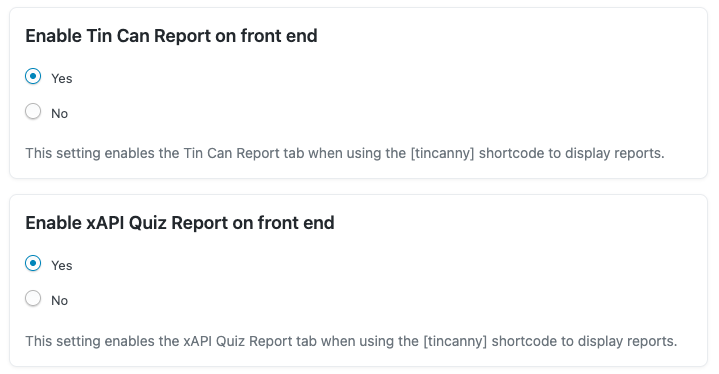
Note: The Tin Can and xAPI Quiz reports are not enabled by default. To turn these reports on, go to Tin Canny Reporting > Settings in your admin panel and enable the appropriate options:
Who can view them
Tin Canny checks each viewer’s role and group membership:
- Administrators see all data.
- Group Leaders see only their assigned groups. Leaders of multiple groups get a group-selector dropdown to switch between teams.
- Learners do not see these admin reports (the learner-facing quiz report is separate — see Front End Quiz Reports).
Sorting and defaults
- Sortable columns: as of v5.1.1, the front-end User Report’s % Complete and Avg Quiz columns are sortable, so managers can rank learners by progress or performance with a click.
- Defaults carry over: the default group and default page length set under Tin Canny Reporting > Settings also apply to the front-end reports, so a leader’s page opens already filtered and paginated.
Enabling Tin Can / Quiz reports
The Tin Can and xAPI Quiz reports only appear in the front-end interface if the option Enable Tin Can Report on front end and Enable xAPI Quiz Report on front end are enabled under Tin Canny Reporting > Settings under the Reports heading.
Styling
Front-end reports intentionally inherit your theme’s styles so they blend in. On some themes you may want light CSS adjustments for table width or spacing.
Related Articles
- Front End Quiz Reports — learner- and group-facing quiz reports
- Tin Canny Shortcodes & Blocks Quick Reference — every report shortcode and block
- Give Managers Their Own Reports — the self-serve reporting use case
- Setting up Tin Canny Reporting — enabling data capture and setting defaults
Would it be possible to have a Front End Report for just the logged in user – “My Scores” or “My Experience” or something like that?
LearnDash provides a shortcode that displays the user’s scores and progress: ld_profile. If that doesn’t display what you’re looking for, there’s a Learner Transcript module in the LearnDash Toolkit Pro: https://www.uncannyowl.com/knowledge-base/learner-transcript/
This is great! If I buy it, can I install it on both my live site as well as my dev server?
Hi Darrin,
You’re welcome to use the plugin on any development sites. Just activate the license on the live site only; the plugin will work on your development sites without issue, you just won’t get automatic updates or support for those environments.
Hello, I have only one course with a few lesson. Is it possible to have report about lessons ? Is it possible to have different presentation of datas ?
Thanks a lot !
Right now I’m afraid we don’t have reports available centred around lessons. These reports also have fixed columns and data available.
Thanks for your reply. I cannot create courses with video, they can only to be added in lessons. Is there an other way to create stats on lessons ? Thank you
It really depends on what metrics you want to get from lessons. Lessons only have 2 states: complete and incomplete. On a per-user basis, this report does show lesson individual lesson completions. Our plugins do not offer options for reporting on lessons at a summary level though.
Hi! Do you maybe have a demo of Tin Canny Front End Learndash Reports? I’d really want to see if this is what I need before I buy a license. Thanks!
Of course! All of our plugins can be tested at https://learndash.uncannyowl.com/. Please let us know if you have questions about it (via a contact form on this site).
is there is a way to report on a specific group?
Yes, Group Leaders that are in more than 1 group will see a drop-down at the top to select a group. If you’re not seeing this, maybe you can raise a ticket and confirm the role of the user and that the user is a Group Leader for multiple groups?
Is there a way to hide some of the columns?
Probably–you should definitely open a ticket and we’ll see how we might be able to help. At minimum a CSS solution should be available.