A pass/fail score tells you the outcome. It doesn’t tell you why a third of your learners struggled with Module 3, which quiz question everyone gets wrong, or whether people are rushing through your most important lesson. Tin Canny’s xAPI and Tin Can tracking shows you what’s happening inside your content — so you can make it better.
Beyond “did they pass?”
When you publish an Articulate, Captivate, or iSpring module as SCORM or xAPI, it emits a stream of detailed statements as learners interact with it. Tin Canny captures every one in your site’s built-in Learning Record Store and turns it into reports you can actually read.
That means you can answer questions a completion report never could:
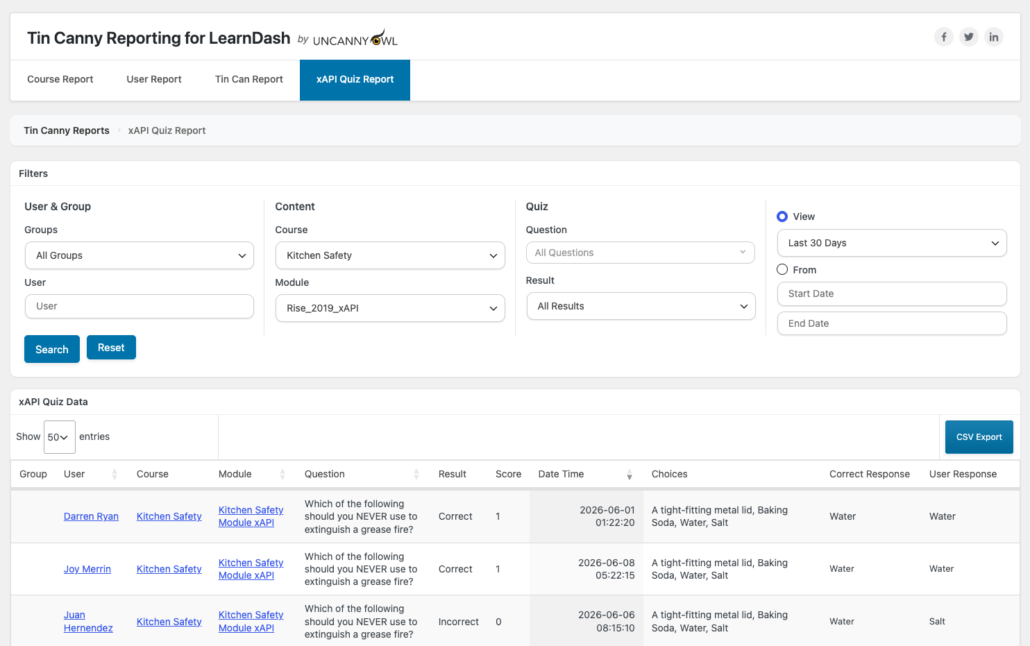
- Which questions are too hard (or too easy)? The xAPI Quiz Report shows responses question by question, so you can spot the item 70% of learners miss — and fix the content or the question.
- Where do learners drop off? Statement timestamps reveal where engagement stalls.
- Are people rushing? With the Simple Course Timer integration, time-in-content tells you whether learners are absorbing material or speed-running it.
- Which content performs best? Compare completion and scores across modules to see what’s working.
The reports that reveal it
xAPI Quiz Report — question-level insight
See every learner’s answer to every question from your modules, including richer question types. As of recent releases, the report renders clear labels even for Storyline matching and Likert-scale questions, so survey-style and drag-and-match interactions show up properly instead of as blanks.
Tin Can Report — the raw activity stream
Every interaction, in order, with timestamps. Useful for understanding the path a learner took through interactive content, not just the result. Tin Canny automatically de-duplicates noisy “passed” statements so the stream stays readable.
Course & User Reports — the zoomed-out view
The Course Report charts recent activity and surfaces your most- and least-completed courses, so you can see at a glance which content is landing. The User Report lets you drill into any individual learner’s full journey.
Turn insight into better courses
A simple, repeatable loop:
- Publish your module with xAPI (or SCORM) and embed it in a lesson.
- Let a cohort run through it.
- Open the xAPI Quiz Report and look for questions with low success rates or unexpected answer patterns.
- Revise the slide, the explanation, or the question — then re-upload using Replace content so your historical data and module ID are preserved.
- Compare the next cohort’s results.
Why this matters
- Improve outcomes, not just measure them. You learn where learners struggle, not only that they did.
- No external analytics stack. The LRS is inside WordPress; the reports are built in.
- Works with the tools you already use. Storyline, Rise, Captivate, iSpring, and H5P all feed the same reports.
Related Articles
- xAPI Quiz Report — question-by-question response data
- Tin Can Report — the raw statement stream
- LearnDash Quiz Question Analysis Report — spotting problem questions in LearnDash quizzes
- Managing eLearning Content — replacing content without losing data